Blog
Why did my sales forecast change?
“The forecast dropped $400k since last week.” Okay — but why? Until you can answer that, you can’t act on it, and you certainly can’t defend it to the board. “The model changed its mind” is not an answer. The good news: a forecast move is never a single event. It’s the sum of a handful of specific, nameable changes, and if you keep the history you can pull them apart exactly.
The three ways a forecast moves
Between any two dates, a forecast can only change for three reasons. Every real move is some combination of them.
1. Probability shifts (the same deals, more or less likely)
The deals didn’t change size and none came or went — but their odds moved. A deal advanced a stage and its win probability went up; another blew past its close date and its probability came down. This is the risk half of the story: the same pipeline, re-weighted.
2. Amount changes (the same deals, resized)
A deal you were carrying at $80k got re-scoped to $120k, or a renewal came in smaller than list. Same deals, same probabilities, different dollars. Amount changes are easy to miss because the deal count doesn’t move — only the total does.
3. New and dropped pipeline (the deals themselves changed)
Net-new deals entered the period, and others left — closed won, closed lost, slipped to next quarter, or pulled forward into this one. This is usually the biggest single driver of a large move, and the easiest to explain once you can see it.
Seeing the decomposition
Put those three together and “the number moved” becomes a bridge: start at last week’s forecast, add the new pipeline, subtract what dropped, apply the amount changes, apply the probability shifts, and you land exactly on this week’s number — with every dollar attributed.
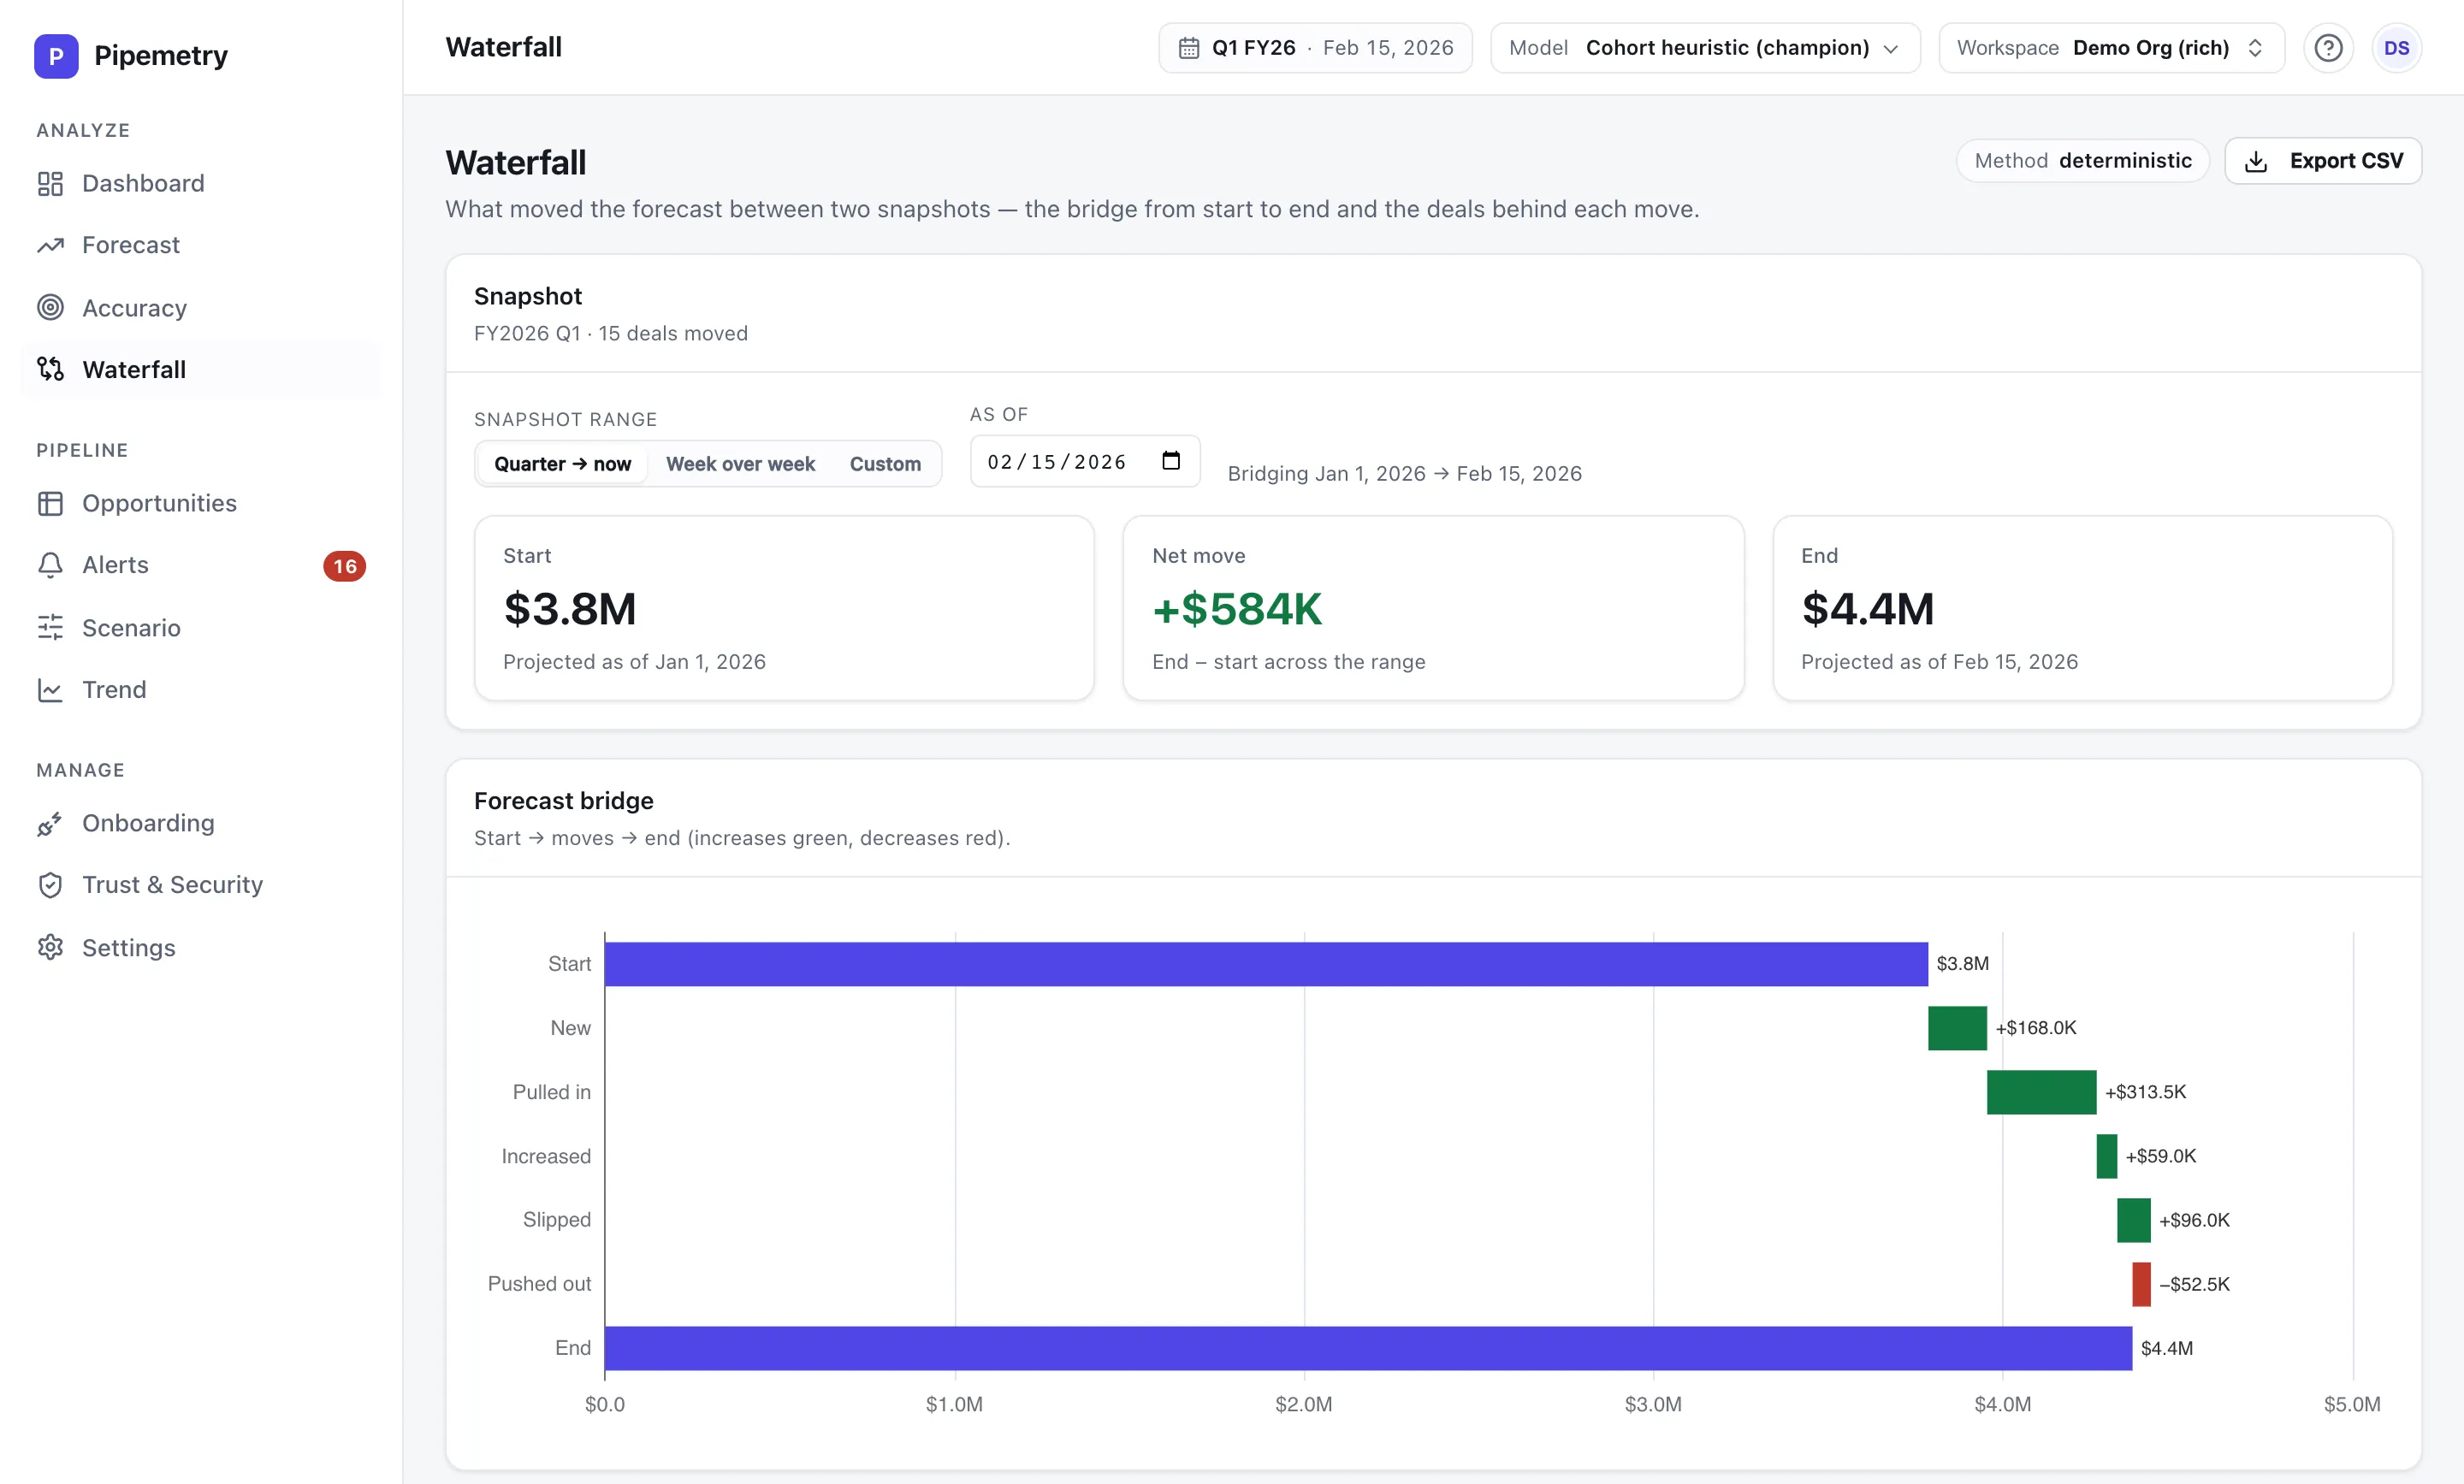
This is what the pipeline waterfall does: it reconciles two points in time into the specific moves between them. Alongside it, Pipemetry writes a plain-English narrative of the change — generated only from your reconstructed data, never invented — so a manager can read why the number moved without decoding a chart.
Why this needs point-in-time history
You can only build this bridge if you know exactly what the pipeline looked like on both dates. A CRM report shows you today and quietly overwrites last week, so the deals that slipped out look like they were never there and late-added deals inflate the baseline. Every decomposition built that way is subtly wrong.
Pipemetry keeps an event log of every change and rebuilds any past day exactly, so the two snapshots the bridge compares are both real. That same history is what makes the per-deal win probability and drivers explainable — the deal-level “why” that rolls up into the forecast-level “why.”
From explaining moves to trusting the number
Decomposing a change tells you why the forecast moved; a backtest tells you whether to trust where it landed. Together they turn the forecast from a number you report into a number you can defend. And once you’re grading calls, read how to measure sales forecast accuracy to score them against the pipeline as it actually looked on the day each call was made.