Forecast from a spreadsheet
Forecast your pipeline from a spreadsheet — no CRM required.
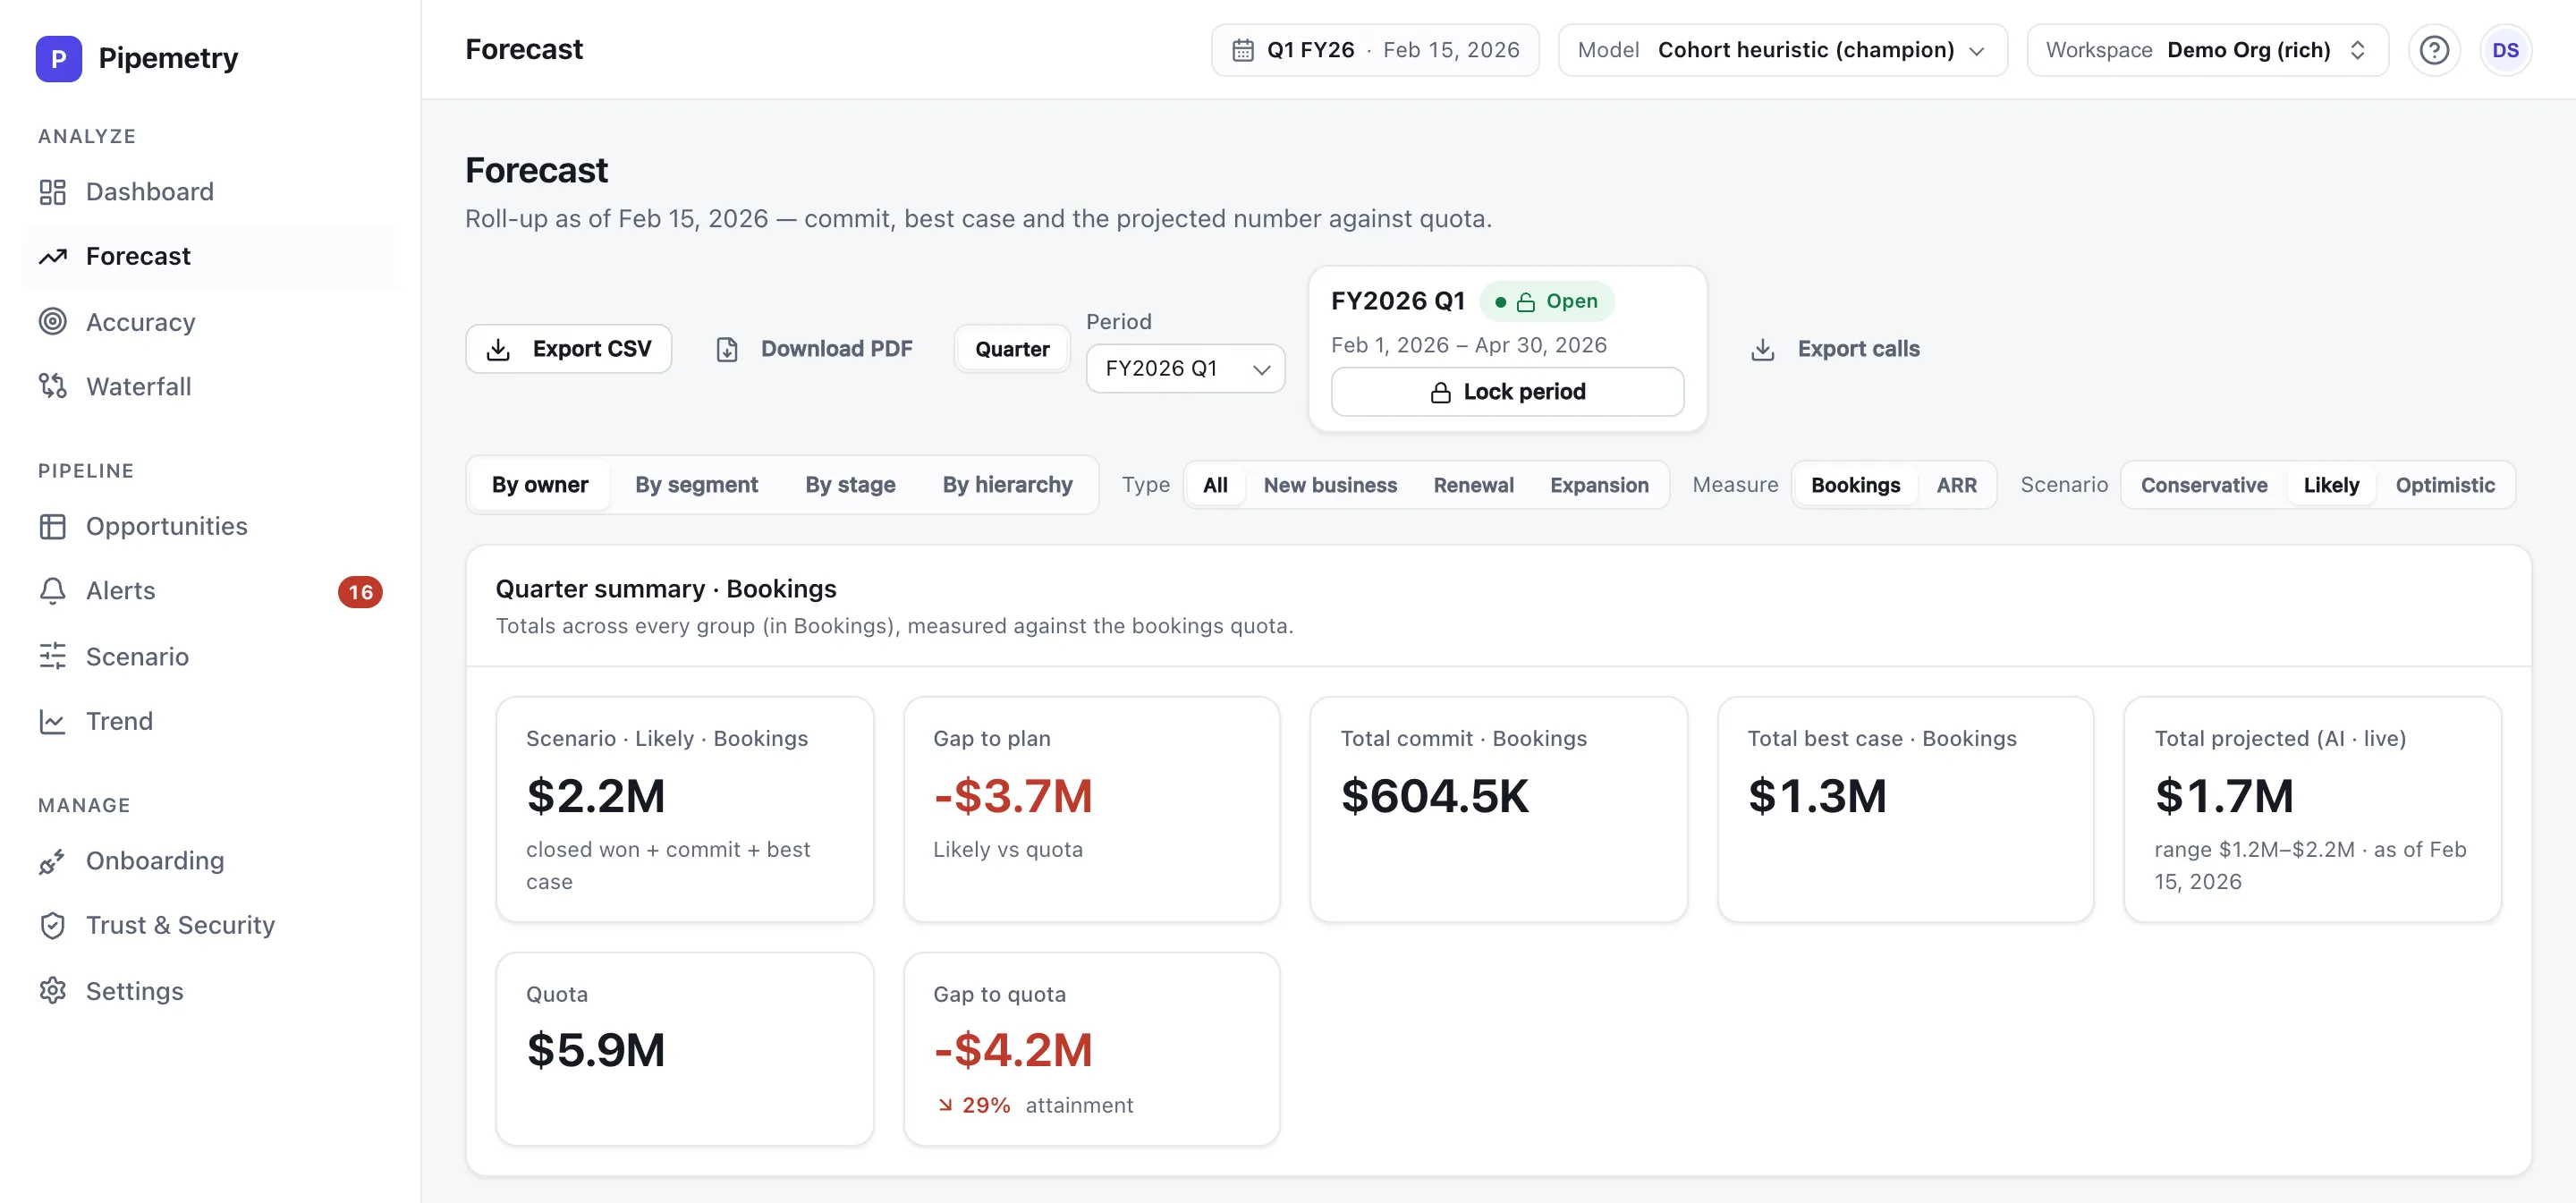
No Salesforce. No HubSpot. No seat minimum. Plenty of small teams run their pipeline in a spreadsheet — so start from the spreadsheet you already have. Upload a CSV export, map your columns once, and day one you get a transparent forecast, coverage, risk alerts, and opportunity analytics. The waterfall, rewind, and backtest deepen as weekly re-uploads build your history.
14-day full-Pro trial, no card · Try it on sample data before you upload a thing
Why a spreadsheet is enough to start
A revenue forecast doesn’t need a CRM — it needs a clean record of your deals and their history. Pipemetry treats your uploaded rows exactly like the events it reads from a connector: it reconstructs a point-in-time pipeline you can rewind, forecasts it with models you can inspect, and scores how accurate each call turns out to be. The spreadsheet is just the way the data gets in.
No Salesforce. No HubSpot. No seat minimum.
Most forecasting layers assume you already run — and pay for — a big CRM, and gate everything behind that connection. Pipemetry doesn’t. If your CRM is a spreadsheet, you are not an edge case here; you are the point. Four things about that are genuinely unusual:
- Sample data before you share anything. Seed your own workspace with clearly-labelled synthetic data and click through the whole product before any upload or connect.
- A card-free, full-Pro 14-day trial. Every Pro feature on your own data, no credit card, and you only pick a plan when the trial ends.
- No seat minimum. Plans are per seat — start with the seats you actually have, not an enterprise floor.
- No implementation fee. Setup is self-serve: upload, map your columns once, forecast. No mandatory services engagement.
How it works
-
Export or build a spreadsheet
Export your open deals from whatever CRM you run — .csv or .xlsx, and an Excel workbook uploads as-is — or start from a plain spreadsheet if you don’t run one at all. One row per opportunity.
-
Map your columns once
A guided mapping step asks what each column means — amount, stage, close date, owner, forecast category, deal type, ARR. It’s the same field-mapping flow a live CRM connection uses, so you set it once. If a deal-type value in your sheet doesn’t map to a forecast type, the import tells you at upload time rather than leaving you to find a blank quarter later.
-
Get a forecast the same day
Pipemetry turns the upload into a point-in-time event log and runs the same models it runs on a live CRM: a transparent forecast, coverage, and alerts on day one, with the waterfall and rewind building up as re-uploads accrete history.
What you get
-
The same engine, no CRM required
Your upload becomes the same point-in-time event log Pipemetry builds from a live CRM connection. That means the same inspectable forecast models, the same p10–p90 confidence bands on Pro, and the same accuracy tracking — on a spreadsheet.
-
Re-upload to update — no duplicates
Ingest is deterministic and idempotent: re-upload your sheet each week and Pipemetry reconciles the rows rather than double-counting them. It reconstructs your pipeline history from the sequence of uploads, so the waterfall and rewind still work.
-
Map the columns you already have
The guided column-mapping mirrors the CRM field-mapping flow: point Pipemetry at your amount, stage, close date, owner, category, deal-type and ARR columns once, and it remembers. Bad rows — missing amount, a close date in the past — are flagged, not silently dropped, and so are deal-type values that back no forecast type.
-
Clean data in, honest forecast out
A forecast is only as good as the pipeline behind it. The same hygiene checks Pipemetry runs on a CRM apply to an uploaded sheet — see the CRM data hygiene checklist for the fields worth fixing before you forecast.
-
Try it on sample data first
Not ready to upload a real file? Seed your own workspace with realistic sample data and click through forecast, waterfall, accuracy, and alerts in minutes. It’s clearly-labelled synthetic fiction, never mixed with anything real, and it’s wiped automatically before your first real import or CRM connect.
-
Outgrow the spreadsheet later
When you’re ready, connect Salesforce, HubSpot, Pipedrive or Zoho CRM and the same models carry over — no re-learning the tool. Until then, the spreadsheet is a first-class way in.
Who it’s for
This is the honest answer for a team whose CRM Pipemetry doesn’t connect to natively yet, or that runs pipeline in a spreadsheet by choice — from a handful of reps up to 100. From the first upload you get the forecast, coverage, alerts, and opportunity analytics; as weekly uploads build history, the point-in-time pipeline analytics deepen — a waterfall of what changed, rewind to any past upload, and accuracy you can backtest once closed quarters accumulate. If you’re weighing tools for a smaller team, start with how to choose revenue forecasting for a smaller team.
Forecast-from-a-spreadsheet FAQ
Can I forecast without Salesforce, HubSpot, Pipedrive or Zoho?
Yes. Upload a .csv or .xlsx export from any CRM — or the plain spreadsheet you already keep — map your columns once, and Pipemetry builds the same point-in-time event log it would from a live connector. You get a transparent forecast, coverage, and risk alerts on day one; the waterfall, rewind, and backtest build up as repeat uploads add history. No supported CRM is required to start.
What columns does my spreadsheet need?
One row per open opportunity, with columns for the deal amount, stage, expected close date, and owner — a forecast category is helpful but optional. During the guided mapping step you tell Pipemetry which of your columns is which, so you don’t have to rename anything first.
Does re-uploading duplicate my numbers?
No. Import is deterministic and idempotent: re-uploading a sheet reconciles the existing rows instead of double-counting them, and Pipemetry reconstructs your pipeline history from the sequence of uploads. Re-upload as often as you like to keep the forecast current.
Can I try it with sample data before uploading a real file?
Yes. You can seed your own workspace with realistic synthetic sample data and explore the whole product first. The sample data is clearly labelled, never mixed with anything real, and is wiped automatically before your first real import or CRM connection.
What happens when I connect a CRM later?
The same forecast models carry over. Connect Salesforce, HubSpot, Pipedrive or Zoho CRM when you’re ready and Pipemetry keeps your pipeline current from the live feed instead of an upload — nothing to re-learn, and your workspace is cleared of sample data before the first real sync.
Forecast the pipeline you already have.
Upload a CSV export and get a transparent forecast the same day — or explore it on sample data first. Already live in a Sheet? Pull your forecast back into Google Sheets too.
14-day full-Pro trial, no card