Sales pipeline analytics
Pipeline analytics that remembers what your CRM forgets.
Your CRM shows the pipeline as it is right now — and silently overwrites what it looked like yesterday. Pipemetry keeps the history: rewind to any past day, read a waterfall of exactly what changed, track coverage against plan, and catch slippage before it becomes a miss.
Analytics starts with history
Every hard pipeline question is a question about change over time: why did commit drop this week? Where did Q2’s created pipeline end up? Which deals slipped, and how often does that rep slip them? Answering those requires knowing what the pipeline looked like then — which is exactly what snapshot-less CRM reporting can’t do. Pipemetry reconstructs any past day from an event log, then builds the analytics on top. The same history powers transparent revenue forecasting, so the number and the explanation always agree. And if you are deciding what coverage multiple to hold teams to, start with our guide to computing the pipeline coverage ratio — and why the 3x rule should come from your own win rate.
What you get
-
Pipeline waterfall
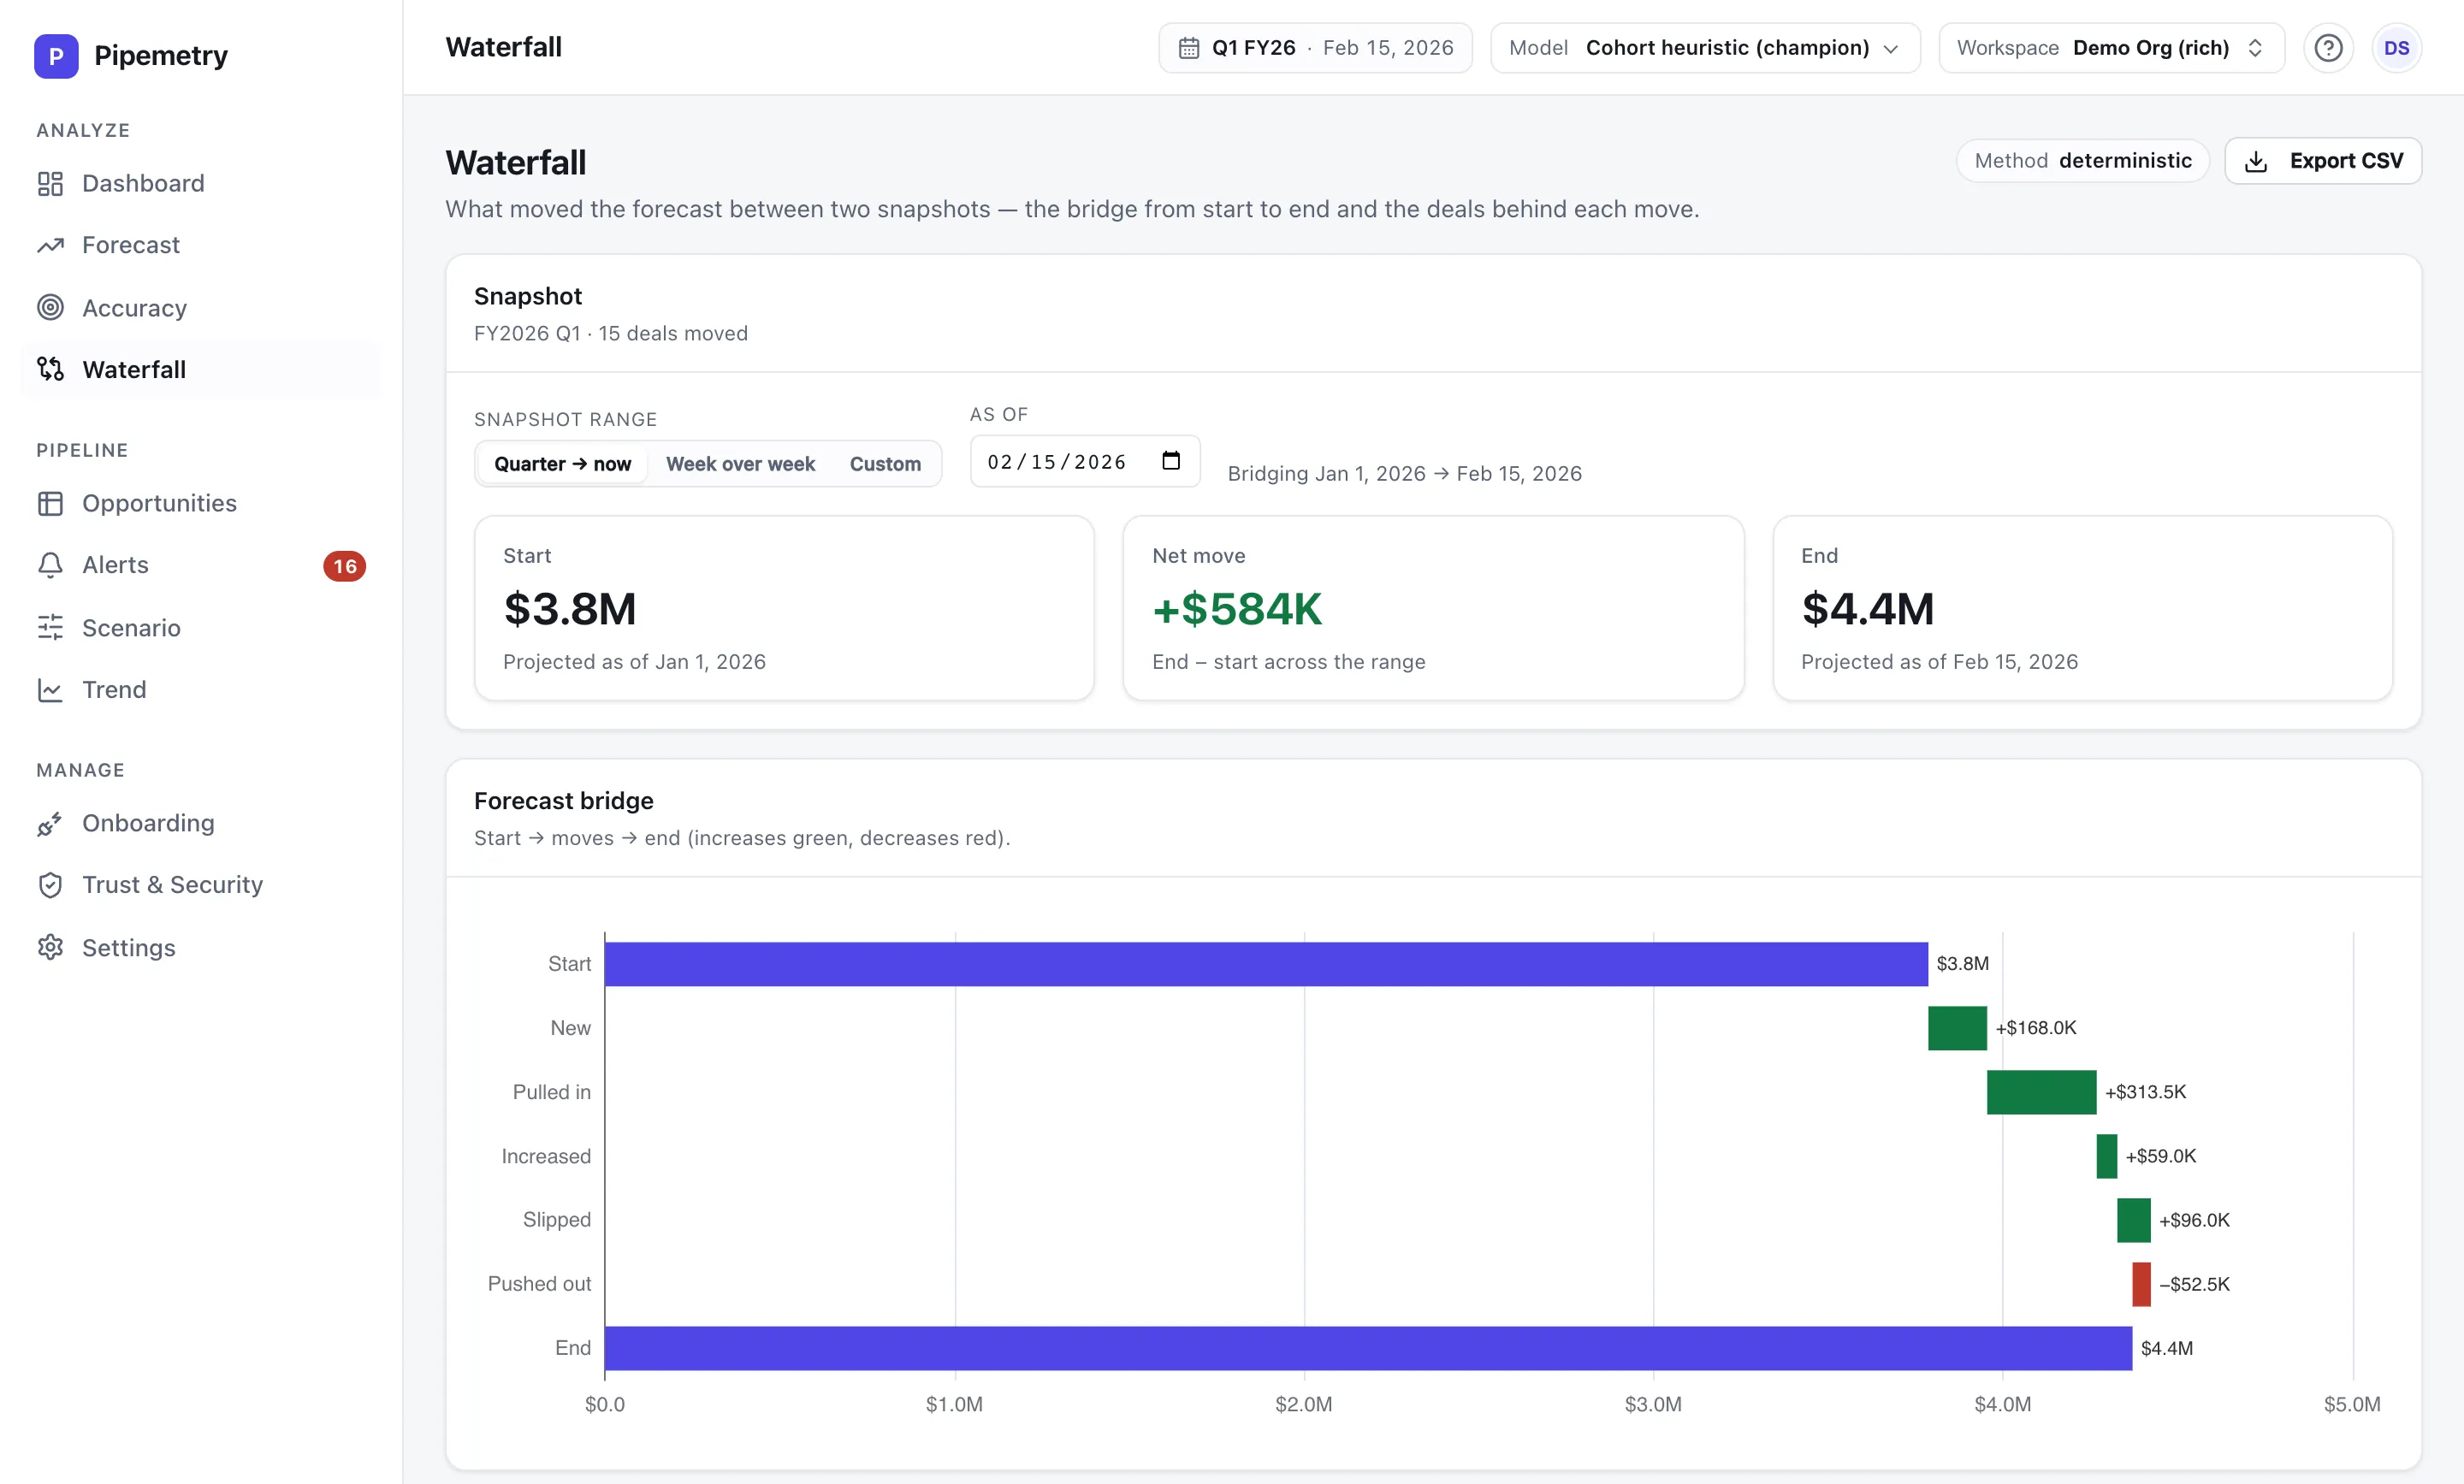
See exactly what changed between any two dates: new pipeline created, deals won, lost, slipped, pulled forward, and resized. The waterfall reconciles this quarter’s number against last week’s — so “what happened since the QBR?” has a precise answer.
-
Point-in-time rewind
Pipemetry stores an event log of every deal change, so it can reconstruct your pipeline as of any past day — last Monday, day one of the quarter, the day before the board meeting. CRM reports only show you now; analytics needs then.
-
Coverage vs plan
Track pipeline coverage against quota by team and period, and get alerted when coverage drops below plan — early enough in the quarter to do something about it.
-
Slippage & stall detection
Deals that slip their close date, stall in a stage, or shrink get flagged automatically, with email alerts on every plan and Slack on Pro. Risk surfaces before the forecast call, not after the quarter closes.
-
Forecast accuracy analytics
Per-owner scorecards track MAPE, bias, and submission compliance over time, so you can see who calls their number and who sandbags — measured against what the pipeline actually looked like on the day of the call.
-
Self-serve on Salesforce, HubSpot, Pipedrive and Zoho
Connect Salesforce, HubSpot, Pipedrive or Zoho yourself — Salesforce over live change-data-capture sync — map fields once, and get a working waterfall and coverage view the same day. Pipemetry never creates or changes a deal — the only thing it ever writes is the optional Pipedrive webhook subscription, and only when you switch real-time updates on. Your CRM stays the system of record.
Pipeline reporting vs pipeline analytics
Pipeline analytics is how you understand the number; pipeline reporting is how the number reaches everyone else. Pipemetry does both from the same event log. The analytics side is the nine-bucket pipeline waterfall bridge and point-in-time rewind — exactly what moved between any two dates, reconstructed rather than remembered. The pipeline reporting side carries it outward: CSV export of every grid on every plan, board-ready branded PDF reports on Pro, board share links for execs without a seat, and a daily digest email that delivers a summary to your inbox. Because both sides read the same history, the report you circulate and the analytics you drill into can never disagree.
Built for SMB & lower-mid-market RevOps
Pipemetry is purpose-built for teams of roughly 10–100 reps that want enterprise-grade pipeline discipline without the enterprise price tag or rollout. Connect Salesforce or HubSpot yourself and see your waterfall the same day — plans start at $29 per seat / month on the per-seat pricing page. Push the waterfall out to Google Sheets for the board deck, or backtest accuracy on your own closed quarters before you trust a forward number.
No CRM? Forecast from the spreadsheet you already have — no Salesforce, no HubSpot, no seat minimum.
Sales pipeline analytics FAQ
What is sales pipeline analytics?
Sales pipeline analytics is the practice of measuring how your pipeline changes over time — what was created, won, lost, slipped, or resized — rather than just reporting its current state. It answers questions like “why did the forecast drop?”, “where did the pipeline we created in April go?”, and “is coverage on plan?”.
Why isn’t a CRM dashboard enough?
CRM dashboards report the current state and overwrite history as deals change. Pipeline analytics needs the history: to build a waterfall or measure slippage you must compare today against an accurate reconstruction of a past day. Pipemetry keeps an event log of every change, so any past day can be reconstructed exactly.
What is a pipeline waterfall?
A pipeline waterfall decomposes the change in pipeline (or forecast) between two dates into its parts: new pipeline created, closed won, closed lost, slipped out of period, pulled in, and deal-size changes. It turns “the number moved” into “here is exactly why it moved”.
Does Pipemetry work with my CRM?
Pipemetry connects to Salesforce, HubSpot, Pipedrive and Zoho, self-serve — Salesforce over live change-data-capture sync — and never creates or changes a deal in any of them — the single exception is the Pipedrive webhook subscription it registers if you turn real-time updates on. Connect, map your fields, and the waterfall, coverage, and rewind views work the same day.
How is this different from revenue forecasting software?
Forecasting projects where you will land; pipeline analytics explains what is happening underneath. Pipemetry does both from the same event log: transparent forecasts with confidence bands, and the waterfall, coverage, and slippage analytics that make the forecast defensible.
Does Pipemetry handle pipeline reporting too?
Yes. Every grid exports to CSV on every plan, Pro adds board-ready branded PDF reports, an admin can share a frozen board snapshot with a private link, and a daily digest email delivers a summary to your inbox — all built on the same nine-bucket waterfall and point-in-time history the analytics use.
Know exactly why the number moved.
Connect your CRM and get a pipeline waterfall you can read — free to start.