Blog
How to measure sales forecast accuracy
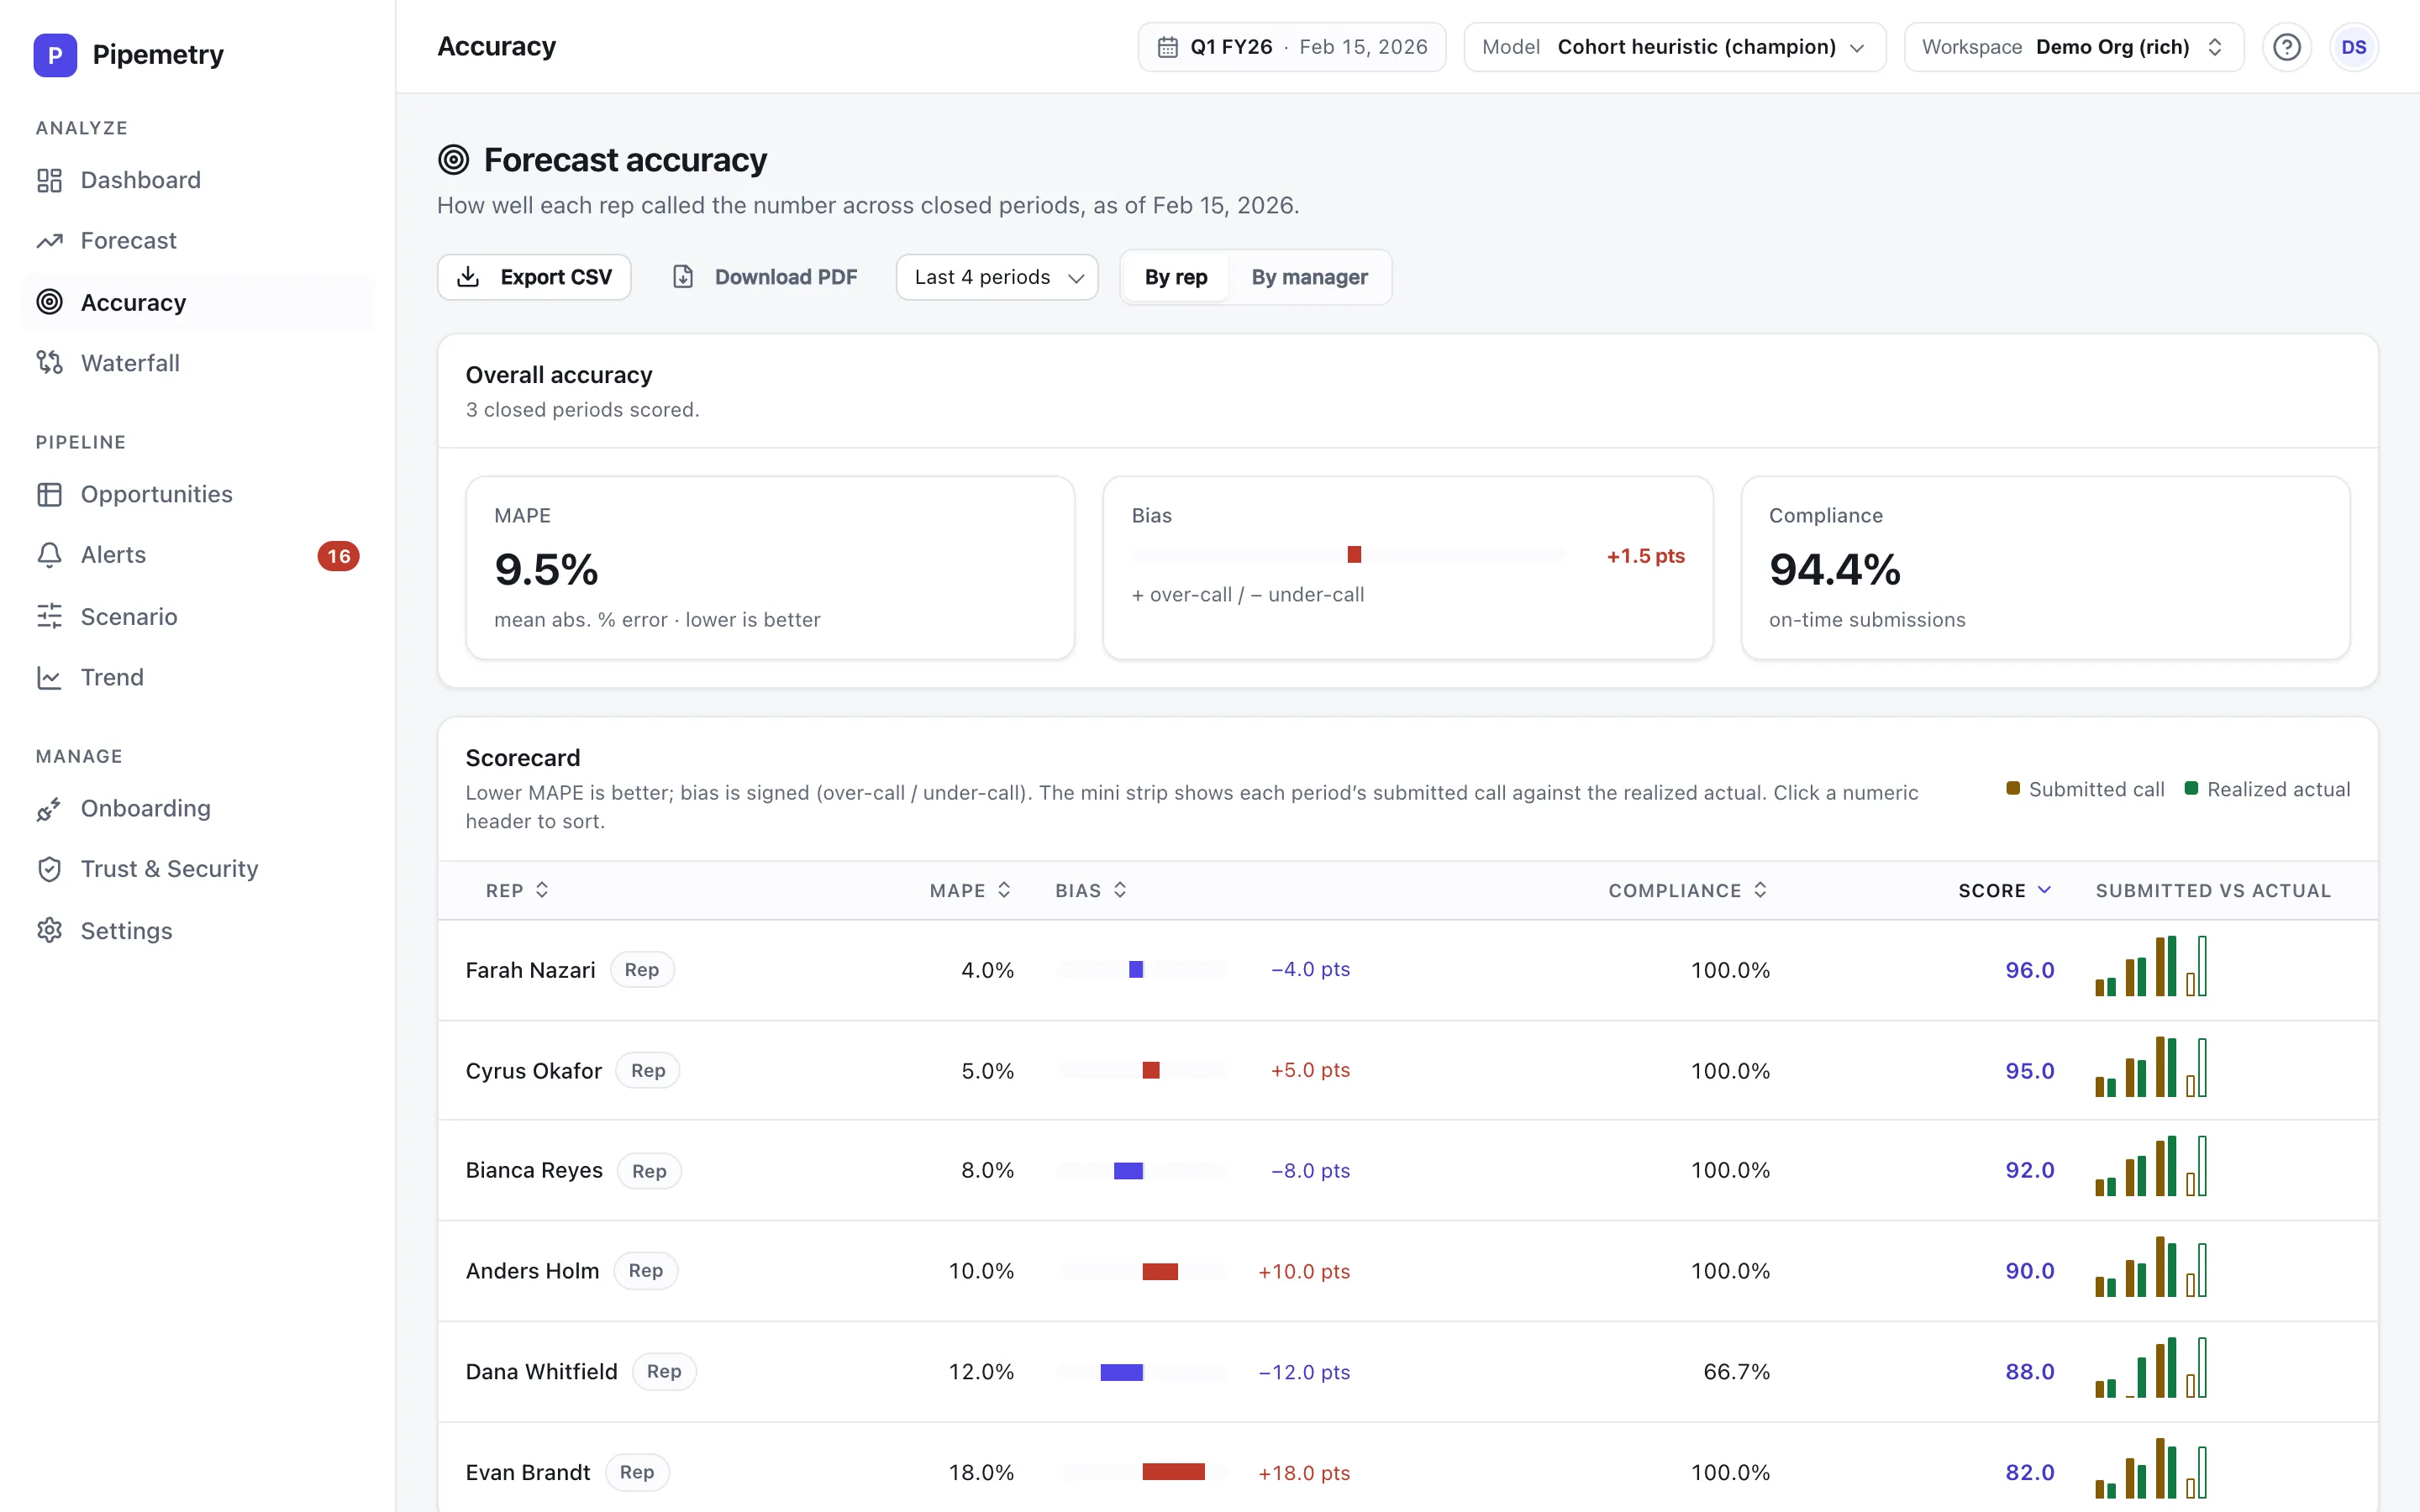
Most teams grade their forecast the same way: the quarter ends, someone compares the final number to the last commit, and everyone moves on. That tells you almost nothing. (Want a quick grade first? The free forecast accuracy calculator turns a few past quarters into a MAPE, a bias, and a letter grade.) Was the miss a late slip, systematic sandbagging, or one big deal that got pulled? Was the first call of the quarter any good, or only the one made in week 12 when the answer was obvious?
Measuring forecast accuracy properly needs three things: the right metrics, a consistent cadence, and — the part most teams miss — a record of what the pipeline actually looked like on the day each call was made.
The metrics that matter
MAPE: how far off, on average
The workhorse is Mean Absolute Percentage Error:
for each period, take |forecast − actual| / actual, then average across
periods. A team calling $500k quarters within ±$50k is running 10% MAPE.
MAPE treats over- and under-calling the same, which is exactly why you also need…
Bias: which direction you miss
Where MAPE is unsigned, bias is
the signed average error — a consistent tendency to forecast too high or too
low. We compute it as (forecast − actual) / actual, averaged across periods.
A rep with 12% MAPE and −11% bias isn’t noisy — they sandbag, consistently.
A manager with +9% bias is systematically optimistic. Bias is the actionable
metric: noise you coach around, bias you can correct at roll-up time.
Hit rate: was the range honest?
If your forecast carries a confidence range (Pipemetry emits Monte-Carlo p10–p90 bands), score the range itself: a p10–p90 band is an 80% prediction interval (see Hyndman & Athanasopoulos, Forecasting: Principles and Practice), so actuals should land inside it about 80% of the time. Land inside 99% of the time and the band is too wide to mean anything; 50% and it’s false confidence.
Submission compliance: did people actually call it?
Accuracy only exists if calls happen. Track who submitted a forecast each period, on time. A hierarchy where half the calls are missing isn’t forecasting — it’s one person guessing with extra steps.
The snapshot problem
Here’s the part that breaks in a CRM: to score the call a rep made on February 15, you need the pipeline as it was on February 15 — which deals existed, their stages, amounts, and close dates. Your CRM has since overwritten all of it.
Scoring this quarter’s calls against today’s pipeline silently rewrites history: deals that slipped out look like they were never called, and late-added deals inflate the denominator. Every accuracy number computed that way is quietly wrong.
That’s why Pipemetry stores an event log of every pipeline change and reconstructs any past day exactly. Each forecast call is scored against the pipeline as of the moment it was made — so scorecards measure judgment, not hindsight. (The same history powers the pipeline waterfall: what changed, when, and why.)
A cadence that works for a 10–100 rep team
- Weekly calls. Reps and managers submit commit and best-case each week, rolled up the hierarchy.
- Score at close. When the period settles, compute MAPE and bias per owner — against the point-in-time snapshots. (Score band hit rate too if you track ranges; see above.)
- Review the trend, not the week. One bad call is noise. Six periods of −10% bias is a coaching conversation with evidence.
- Compare human vs model. Track whether your reps or your model calls it better, per segment — and weight the blend accordingly.
Pipemetry covers this cadence out of the box: per-owner accuracy scorecards (MAPE, bias, submission compliance), point-in-time scoring, confidence bands, and a human-vs-model comparison that learns who to trust. (Band hit-rate scoring is the one piece you’d compute yourself today, from the CSV export.) Connect Salesforce or HubSpot and you’re scoring real calls the same day — see what it costs.